00:03
Once the system is optimized for the 1 in 30 year events,
00:07
it is sometimes required to undertake an assessment of a very large storm,
00:11
such as a 1 in 100-year winter storm.
00:15
During these types of rare storms, it is acceptable for flooding to take place,
00:19
so long as that flooding is managed and does not cause damage to property or risk to people.
00:25
InfoDrainage includes the ability to route flood water across the catchment surface.
00:31
The direction and speed of flood water is determined by the surface data.
00:36
Make sure the surface file is loaded.
00:39
In this example, load imported surface trimmed.idsx.
00:44
This is essential to carry out the 2D Assessment.
00:48
In addition to simulating a very large storm,
00:52
you can artificially induce flooding by reducing the size of one of the upstream pipes.
00:58
But before you do, best practice is to copy a design phase
01:03
so that you can perform the exceedance calculations without altering the data you have so far.
01:09
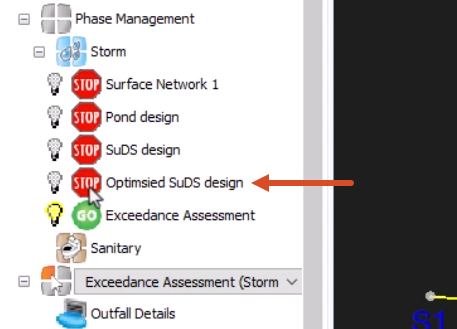
In the Tree View, right-click the phase “Optimised SuDS design”, and select Duplicate Phase.
01:17
Name the new phase “Exceedance Assessment”.
01:22
Then, exclude the Optimised SuDS design phase from analysis and turn OFF its visibility.
01:31
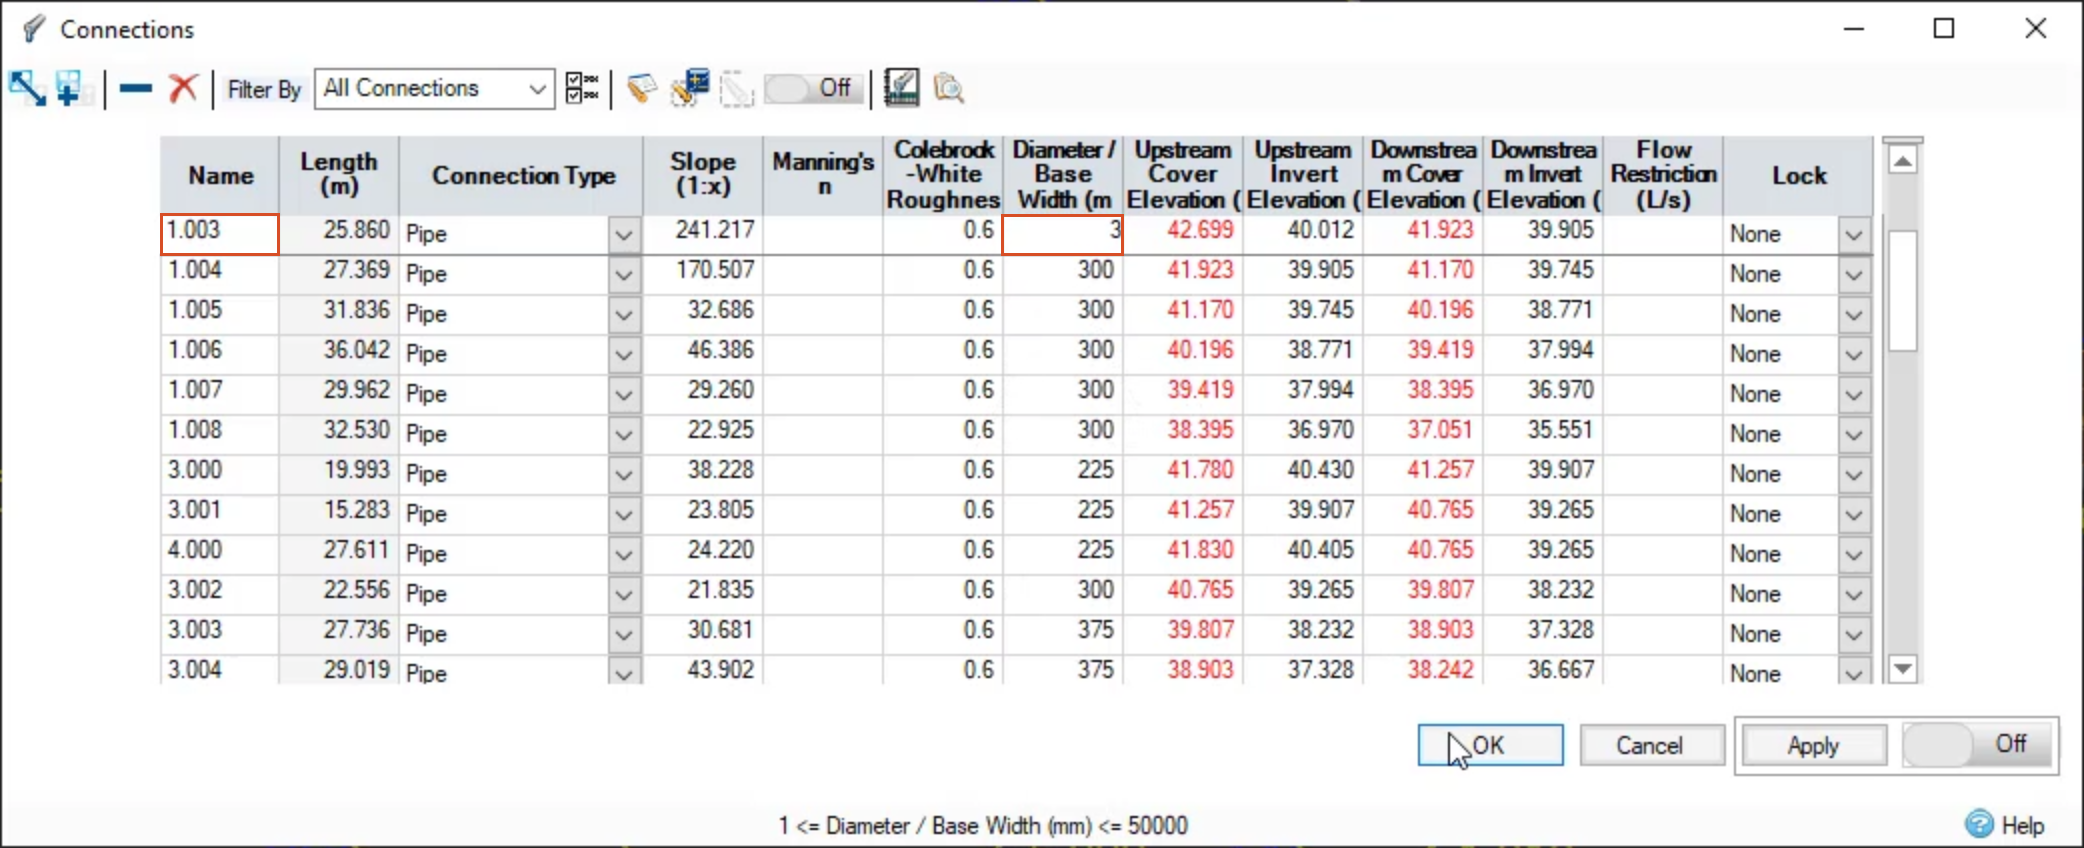
Next, in the model, select pipe 1.003, and then change its size to be just 3 mm in diameter.
01:41
Then, save and validate the model.
01:44
Be aware that, in InfoDrainage, 2D assessments are conducted for one storm at a time,
01:50
as the concept of critical duration does not really apply to flooding across a catchment surface.
01:56
Therefore, the first task is to determine which storm or storms should be used in the 2D analysis.
02:03
On the ribbon, Rainfall/Pollutants tab, Rainfall panel,
02:09
click Rainfall Manager.
02:12
In the Rainfall Manager, Duplicate the SPR Wizard FSR storm and Rename the new study “Exceedance Storms”.
02:24
Set the Return Period to 100 years and the Increase Rainfall value to 40%.
02:32
Save the rainfall event, and name it “100yearplus40”.
02:40
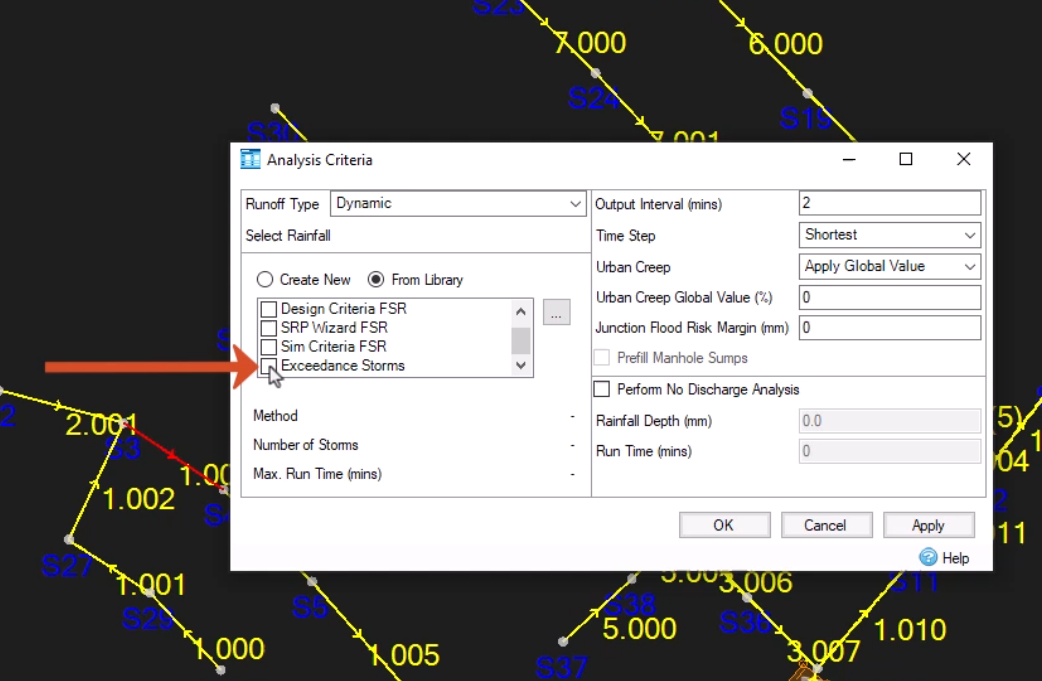
Next, on the ribbon, Analysis tab, Criteria panel, click Analysis Criteria.
02:50
In the Analysis Criteria dialog, under Select Rainfall,
02:55
change the rainfall to the Exceedance Storms event by enabling its checkbox and deselecting any others.
03:02
There should still be 18 storms.
03:07
Next, validate and then run the model.
03:11
Click the Analysis tab on the ribbon again, and then click Validate.
03:16
In the Validate dialog, no errors appear, so save the file.
03:21
Now, you can run the model.
03:23
On the ribbon, click Go.
03:27
Once it has finished the calculations, click Critical Storm.
03:31
The results show that only the Cellular Storage floods.
03:35
The critical duration event for it was the 360-minute winter event.
03:41
You will therefore carry this event forward to 2D analysis.
03:46
In reality, you may want to look at which junctions flood and possibly run a series of simulations.
03:53
On the ribbon, click 1D - 2D Analysis.
03:57
In the 2D Analysis Criteria dialog, keep the Urban setting for Manning’s equation.
04:03
Enter 10 m2 for the Min Element Area—this determines how small the mesh is,
04:10
which is formed from triangles, and therefore how detailed the analysis is.
04:15
It also greatly affects the speed of the analysis.
04:19
Finally, select the Exceedance Storms rainfall and the 100 year +40%: 360 mins: Winter storm to run.
04:31
After the calculations are complete, look at the Stormwater Controls Summary.
04:36
Here, you can see that the results have changed a little in comparison with the 1D simulation.
04:41
In the Tree View, for the 2D Analysis, switch on only the Depth and Legend options.
04:49
In the status bar video controls, click Play Animation to see flooding across the catchment surface,
04:56
or stop the animation to see the worst-case scenario.
05:00
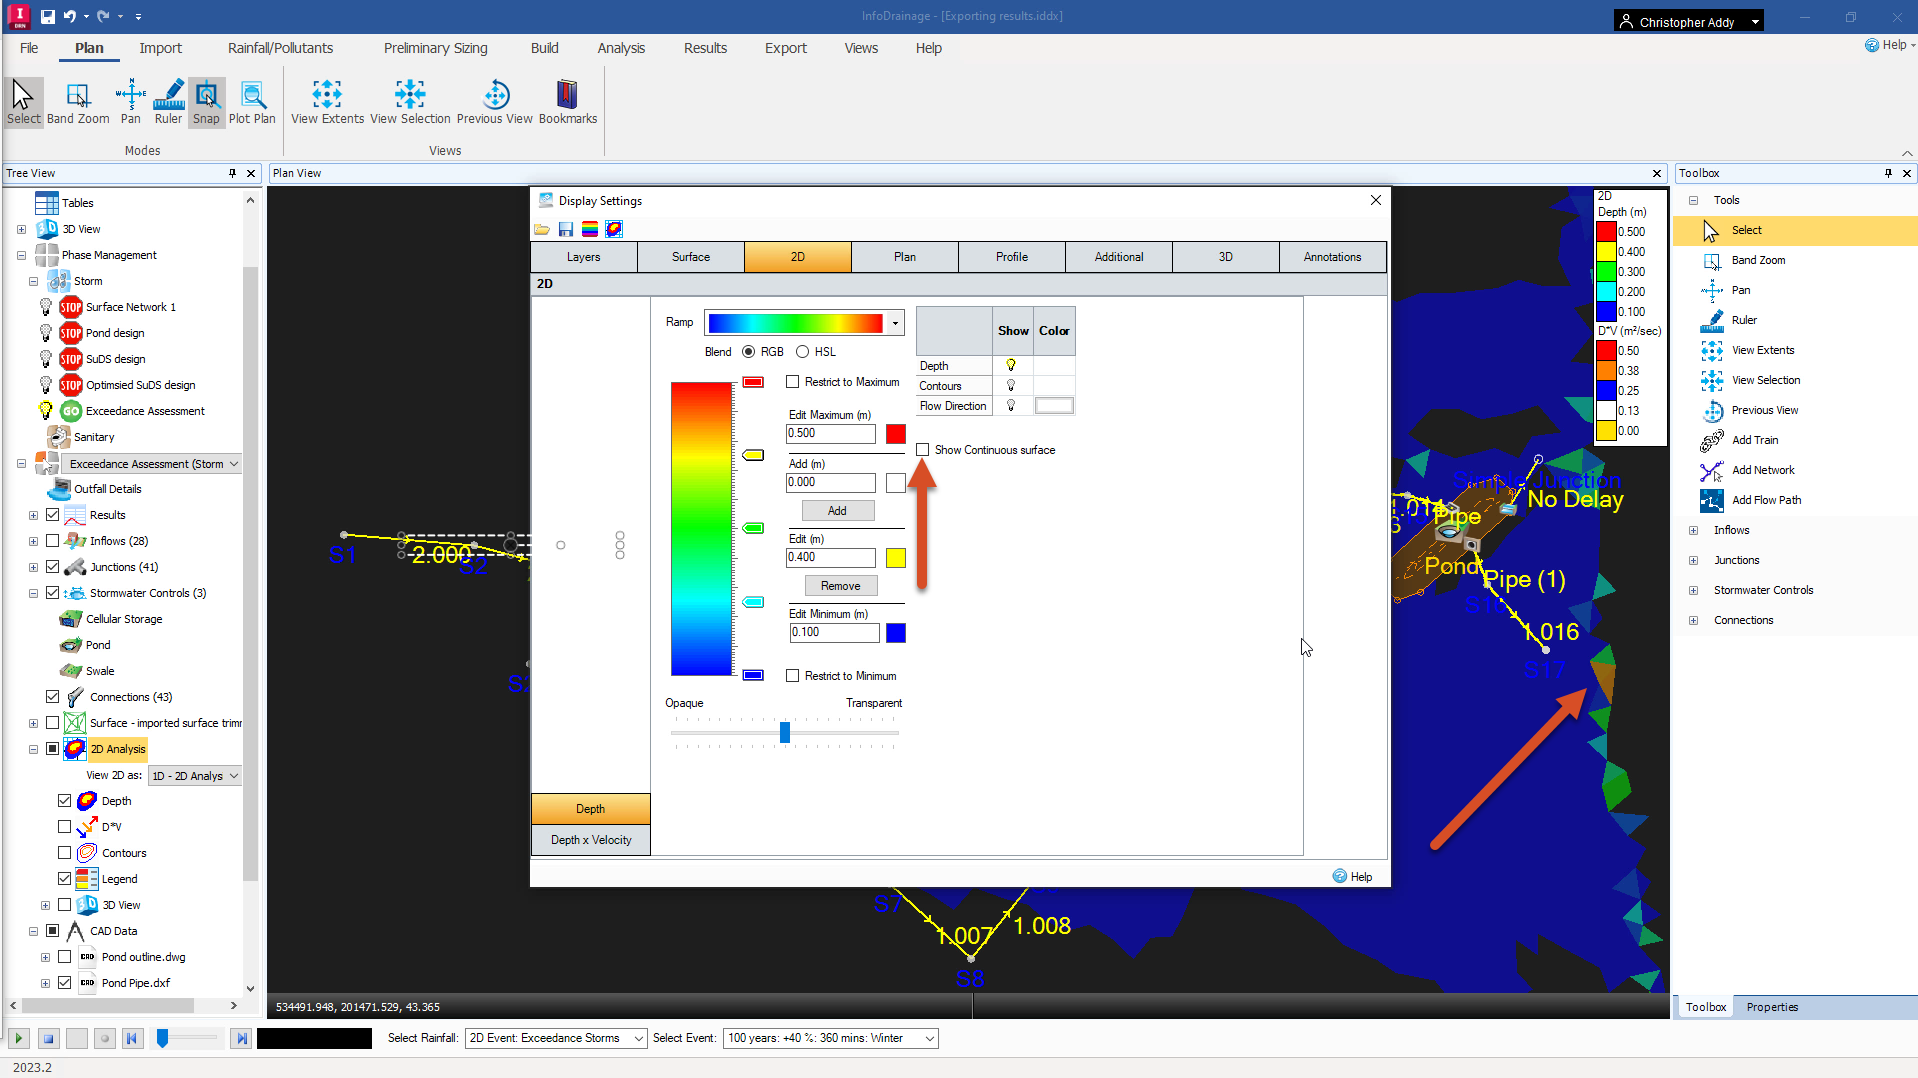
Right-click the 2D Analysis and select Display Settings.
05:06
Here, the Color Ramp dictates the colors of the Depth that can be rendered after a Deluge analysis is run on the surface.
05:14
In the dialog, enable the Depth layer, but leave Contours and Flow Direction deselected.
05:20
Set the Edit Maximum value to 0.5, and the Edit Minimum value to 0.1.
05:27
Expand the Ramp drop-down to choose a color scheme.
05:32
Notice how the surface appears with the Show Continuous surface option ON.
05:37
When Show Continuous surface is selected,
05:40
the grid elevation is applied at the center of each grid square
05:44
and the elevation linearly interpolated in between, which makes it appear fuzzy.
05:49
The Deluge water surface can also be drawn as a series of independent grid elevations.
05:55
Deselect Show Continuous surface.
05:58
Now, the Deluge appears clearly as triangles.