Step-by-step guide
InfoDrainage includes the ability to route flood water across the catchment surface. The direction and speed of flood water is determined by the surface data.
In addition to simulating a very large storm, you can artificially induce flooding by reducing the size of one of the upstream pipes. But before you do, best practice is to copy a design phase so that you can perform the exceedance calculations without altering the data.
- Ensure that the imported surface trimmed.idsx surface file is loaded. This is essential to carry out the 2D Assessment.
To create a new design phase:
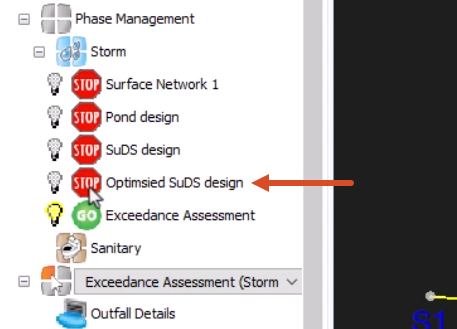
- In the Tree View, right-click the phase Optimised SuDS design, and select Duplicate Phase.
- Name the new phase “Exceedance Assessment”.
- Exclude the Optimised SuDS design phase from analysis and turn OFF its visibility.
To artificially induce flooding:
- In the model, select pipe 1.003.

- In the Connections dialog box, change the Diameter / Base Width of pipe 1.003 to 3mm.
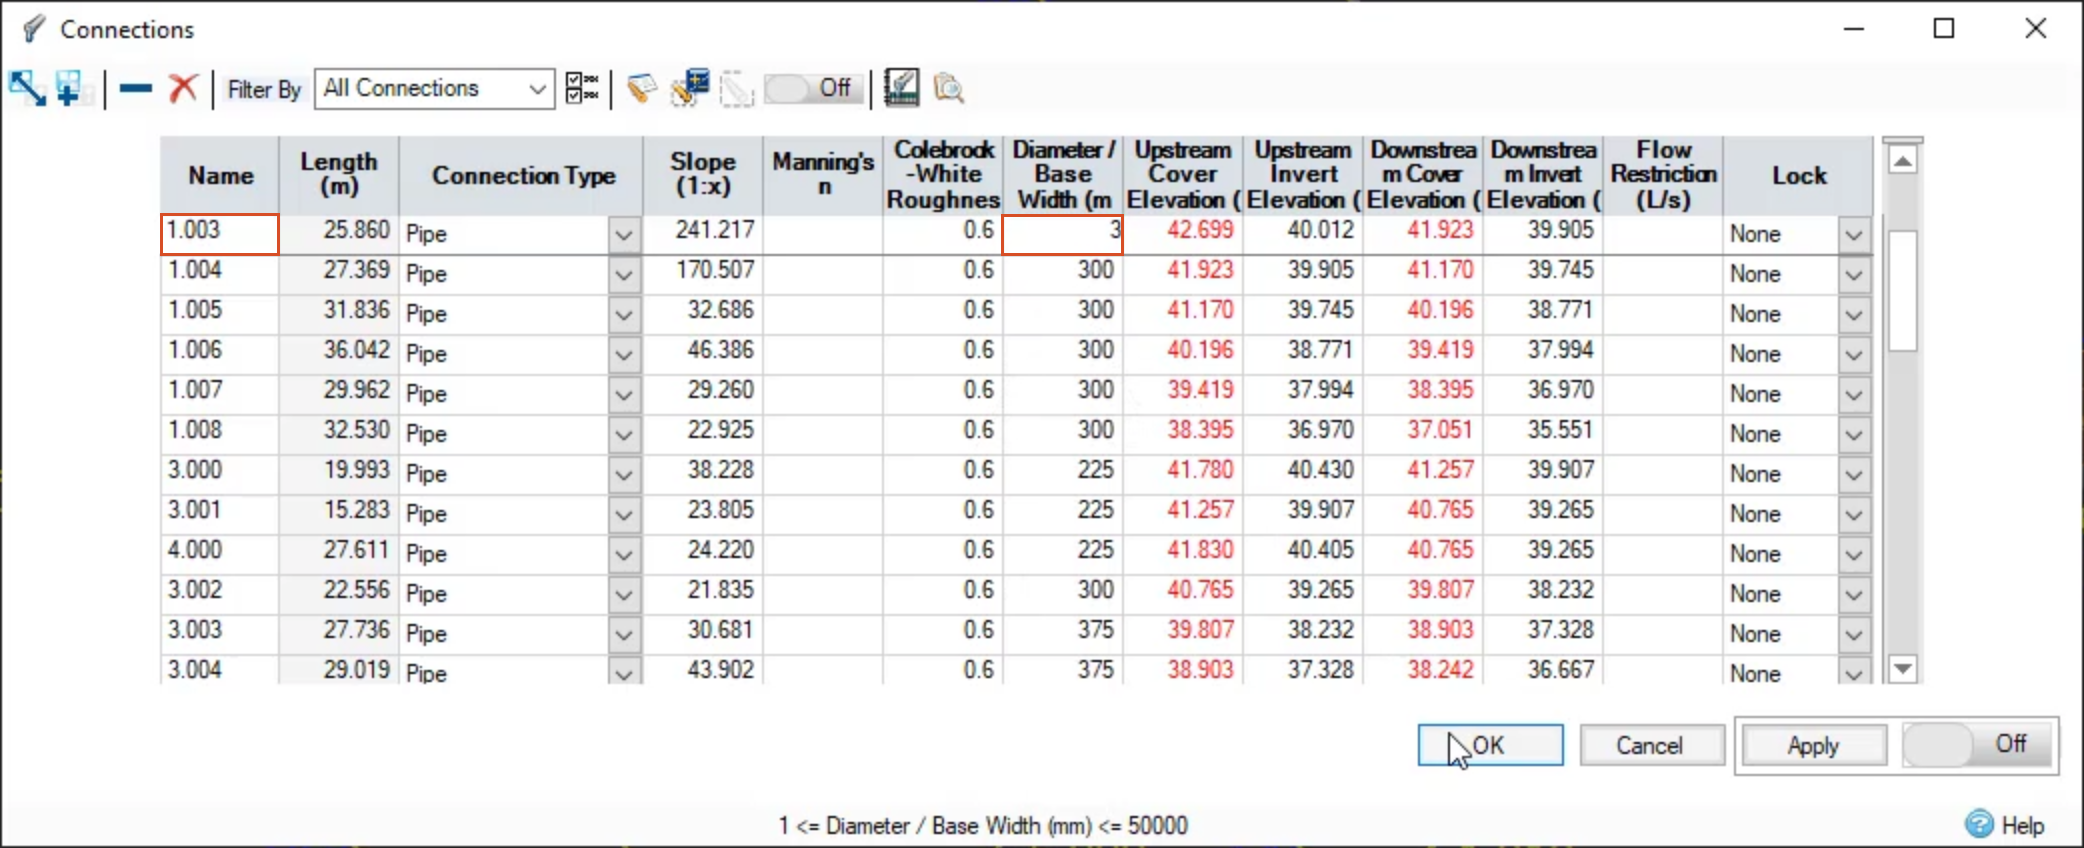
- Click OK.
- Save the file.
- On the ribbon, Analysis tab, Analysis panel, click Validate to validate the model.
- Click OK to close the Validate dialog box.
Be aware that, in InfoDrainage, 2D assessments are conducted for one storm at a time, as the concept of critical duration does not really apply to flooding across a catchment surface. Therefore, the first task is to determine which storm, or storms should be used in the 2D analysis.
To create the flooding simulation:
- On the ribbon, Rainfall/Pollutants tab, Rainfall panel, click Rainfall Manager.
- In the Rainfall Manager, right-click the SPR Wizard FSR storm and select Duplicate.
- Name the new study “Exceedance Storms”.
- Click the Return Periods tab.
- Set the Return period to 100 years.
- Set the Increase Rainfall value to 40%.

- From the Rainfall Manager toolbar, click Save to save the rainfall event.
- Name it “100 year plus 40”.
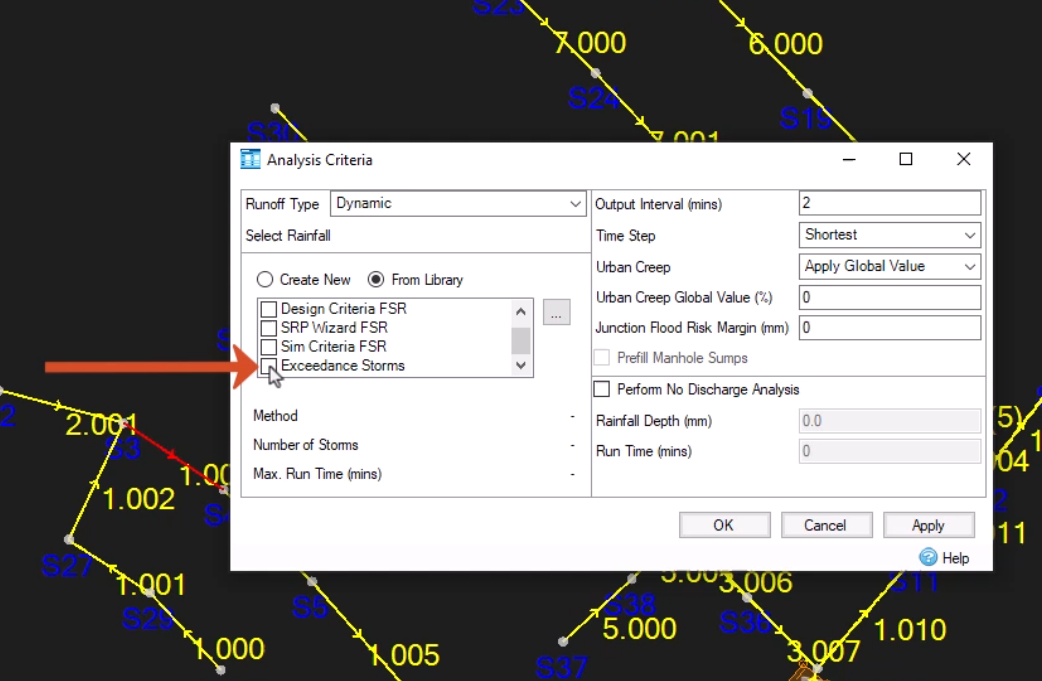
- On the ribbon, Analysis tab, Criteria panel, click Analysis Criteria.
- Change the rainfall event. Enable the Exceedance Storms event. Deselect all others.
- Click the Analysis tab on the ribbon again, and then click Validate.
- Click OK.
- On the ribbon, click Go.
- Once the program has finished the calculations, in the Stormwater Controls Summary, click Critical Storm.
The results show that only the Cellular Storage floods. The critical duration event for it was the 360-minute winter event. You will therefore carry this event forward to 2D analysis. In reality, you may want to look at which junctions flood and possibly run a series of simulations.
- On the ribbon, click 1D - 2D Analysis.

- In the 2D Analysis Criteria dialog box, keep Manning’s n set to Urban.
- Enter 10 for the Min Element Area.
- In the Select Rainfall group box, select the Exceedance Storms rainfall from the drop-down.
- In the Select Storm drop-down, select the 100 years: +40%: 360 mins: Winter storm.
- Click OK.

- After the calculations are complete, review the results in the Stormwater Controls Summary.
- The results have changed little in comparison with the 1D simulation. Close the Stormwater Controls Summary.
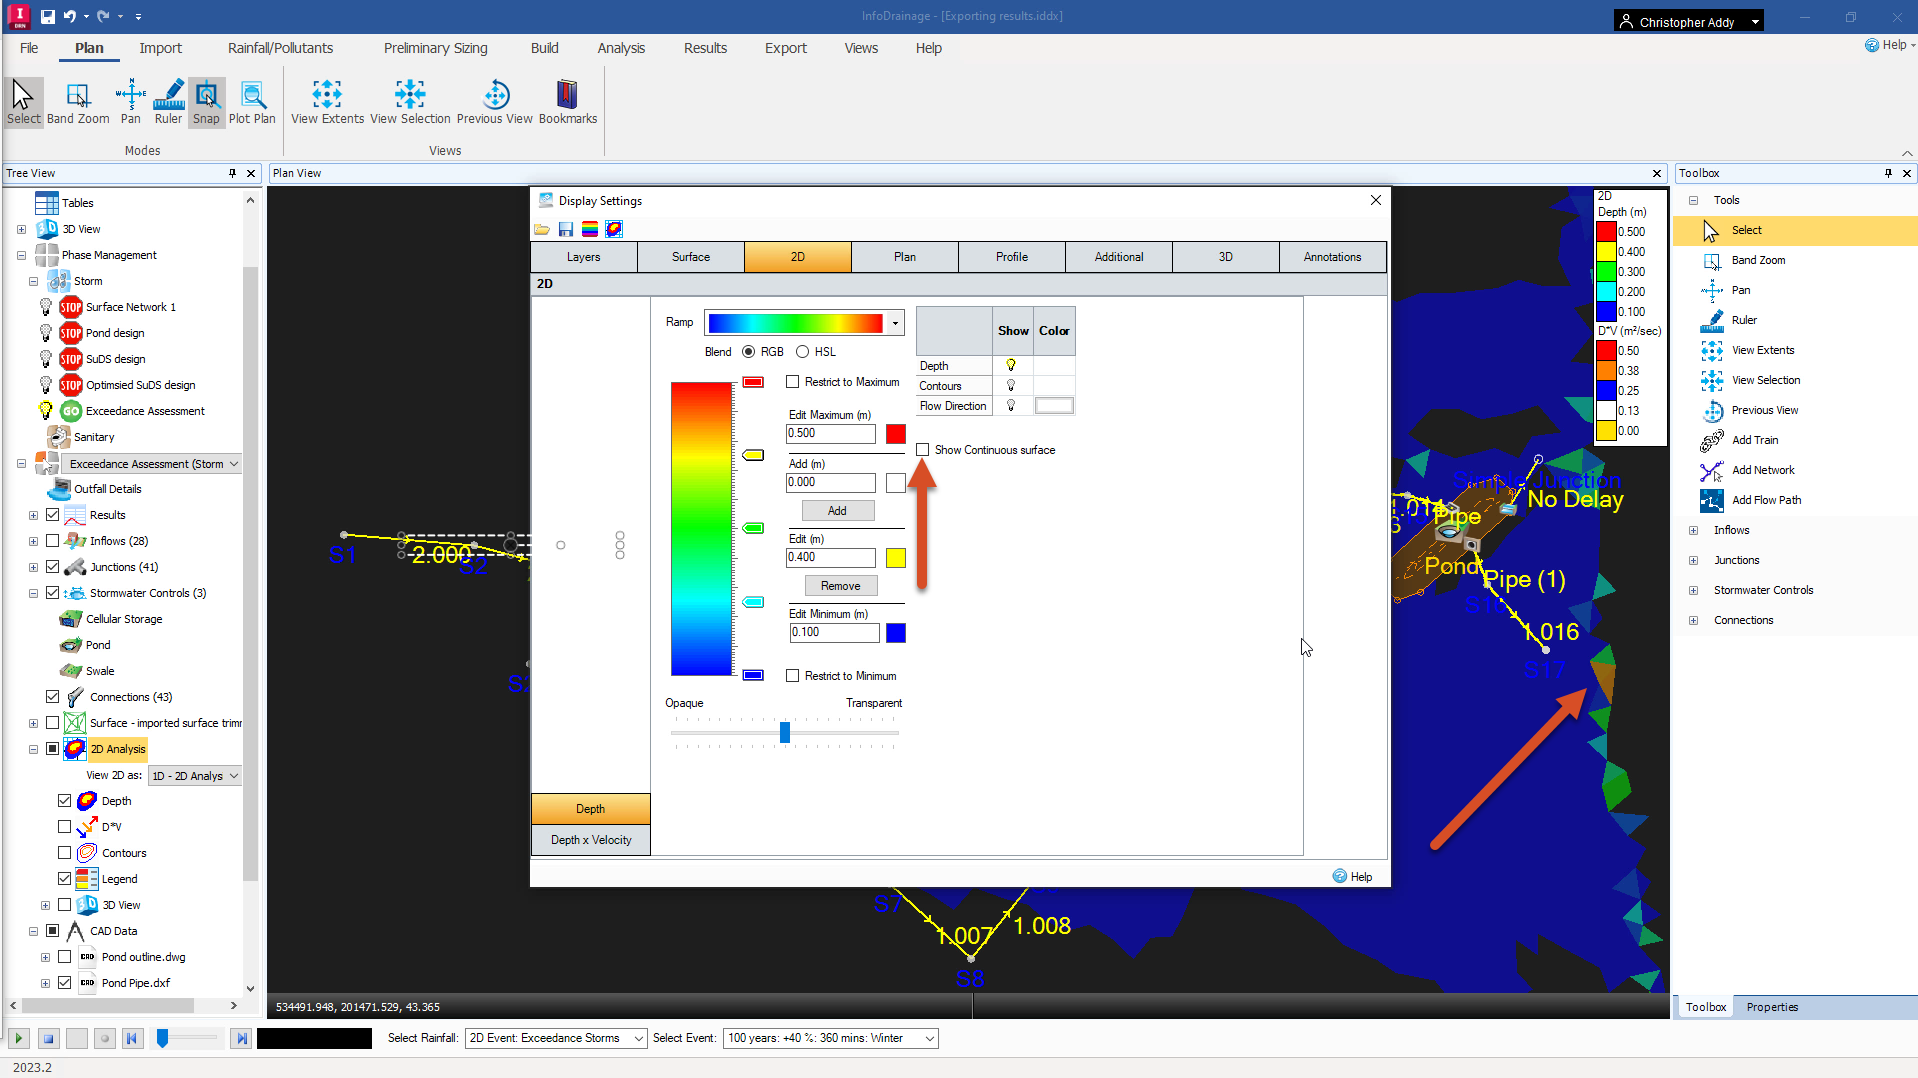
- In the Tree View, for the 2D analysis, enable Depth and Legend.
- From the status bar video controls, click Play Animation to see flooding across the catchment surface.

- In the Tree View, right-click the 2D Analysis and select Display Settings.
- In the Display Settings dialog, enable the Depth layer.
- Leave Contours and Flow Direction deselected.
- Set the Edit Maximum value to 0.5.
- Set the Edit Minimum value to 0.1.
- Expand the Ramp drop-down and choose a color scheme.
- Notice how the surface appears with the Show Continuous surface selected.

- Deselect Show Continuous surface. Now, the deluge appears clearly as triangles.