00:01
GOYO GRZESKOW: Hi there.
00:02
In this video, we will discover different types of analysis
00:04
available within InfraWorks are part of the traffic simulation
00:07
We will learn how to extract helpful data
00:10
or reports crucial for our decision making process.
00:14
This is where we are on the overall view
00:15
of the analysis in civil engineering learning path.
00:20
Let's start analyzing and designing
00:22
the bridge on the PO2 proposal using the Line Girder
00:25
Analysis on how to do structure a bridge design.
00:28
This is an idea of the bridge resting on two piers.
00:31
One with three large columns and the other
00:33
with two small columns.
00:36
On the InfraWorks analysis app, we open the Line Girder
00:39
Analysis tool and then we click on Start to analyze the bridge.
00:45
We can easily display the material quantities
00:48
at different detail level.
00:51
The bridge can be easily exported to Revit
00:54
for further detailing by generating an updatable IMX
01:00
InfraWorks also allow us to extract a linked Excel file
01:04
that contains the parametric bridge geometry
01:07
and from which we are able to modify our model.
01:11
If we open the Excel file created
01:13
we will see multiple tabs that relate to the different bridge
01:17
Note that the blue fields are editable.
01:20
Let's try the functionality by editing the small pier
01:23
to match the large one.
01:25
After completing the edit in Excel remember to save the file
01:28
and within InfraWorks select the option to update the existing
01:34
Notice how the small pier has changed much in the large one.
01:38
Once the line girder analysis has been completed,
01:41
we can see that all the girders or beam are red colored.
01:44
This means that any of them have passed
01:46
these structural requirements of the error codes UK standards.
01:50
We might have sufficient information
01:51
with the results shown within the line girder analysis
01:54
If that's not the case you can use your cloud credits
01:57
to purchase full girder design recommendation
01:59
for the selected concrete bridge by selecting Get Full Report.
02:07
Let's make the girders this bigger
02:09
and rerun the analysis to check if our amendments have
02:11
positively helped the structural behavior of the bridge.
02:15
When you purchase the full report,
02:18
line girder analysis also generates
02:20
is a full model of your bridge that you can open and work
02:23
within in the standard conversion of Autodesk
02:25
structural bridge design.
02:26
Note that as the girders are increased
02:28
the quantities table reflect the changes accordingly.
02:35
So the reason why this analysis is going so fast
02:38
is because it's accelerated.
02:39
Normally it takes several minutes
02:42
to have the analysis done and download end results.
02:45
As you can see now the beams are colored in different way.
02:48
If you hover over them you will see the general working
02:56
If we got the full report and we will
02:58
like to know where it's stored within our computer,
02:60
we will need to follow the following path
03:02
after reaching out the folder where our project is store.
03:07
Once there, we will see the structural bridge design
03:09
files on the model and the PDFs on the report folder.
03:15
InfraWorks allows us to optimize our corridors and profiles
03:19
both horizontally and vertically respectively.
03:22
Under the transportation option of the InfraWorks analyze tab,
03:25
you will find both profile and corridor optimization.
03:29
Simply select the component road and click on Optimize.
03:32
We'll receive an email whenever our optimization
03:35
is ready with a full report attached.
03:37
Additionally we have the option to create
03:39
a new proposal that includes a model with changes optimized.
03:43
Besides the optimization reports,
03:45
there are a couple of simple yet reliable tools
03:47
at the end of your finger tips worth to mention
03:49
and able to explore reports.
03:51
One of them is the material quantities.
03:53
You will be able not only to understand lengths, areas
03:56
and volumes of your road components
03:58
but this report also includes the count of 3D models that
04:01
are part of the component road.
04:03
The other one is the earthwork quantities.
04:05
You can fill volumes for an entire component road,
04:08
a specified station ridge, or multiple selected roads.
04:12
After you make changes to a component road,
04:14
InfraWorks updates the earthworks to fill quantity.
04:17
When editing the road you can quickly
04:19
compare fill volumes between edits
04:22
to get closer to balancing the earth
04:23
works towards a net zero volume.
04:27
Another tool able to give valuable insights
04:30
and help us evaluate our designs is the Sight Distance tool.
04:35
This tool will allow us to understand
04:37
the level of visibility going to sections or component roads.
04:41
It takes into account assembly declarations and city furniture
04:45
that could interfere with a vehicle direct visual line.
04:49
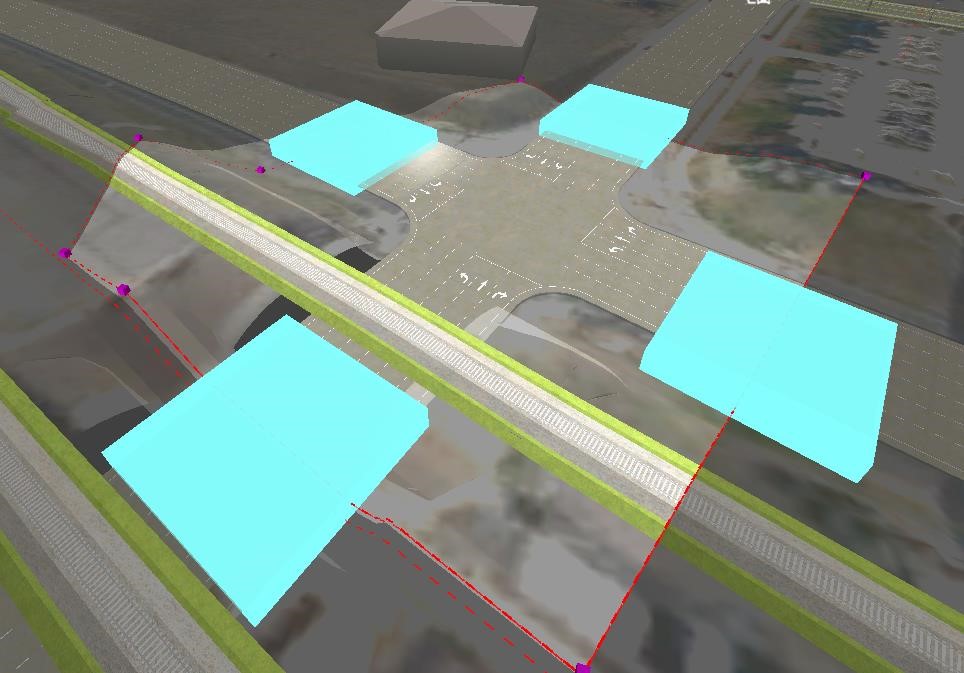
It does not work on roundabout.
04:51
In the example we are checking in an intersection that
04:53
has a sight failure for the vehicles turning left
04:57
at the stop contra position.
04:59
In this particular case, the issue
05:00
is related to the elevation of the road intersecting
05:05
And it can be easily amended by elevating the last PVI,
05:09
Point of Vertical Intersection.
05:19
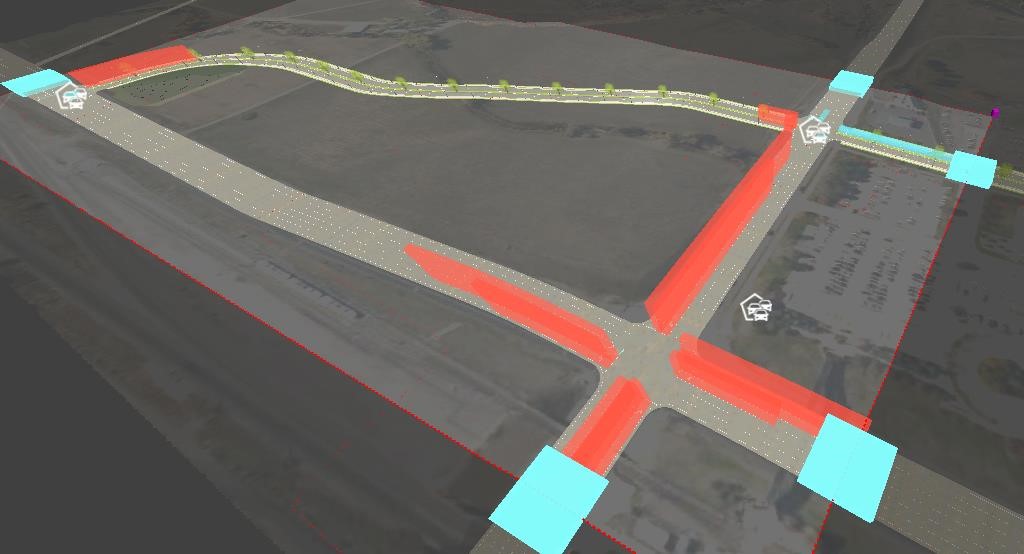
And last but not least, the traffic simulation
05:22
reports we can download from InfraWorks using the traffic
05:25
simulation preview window or ask to cart
05:27
once a simulation has been run.
05:29
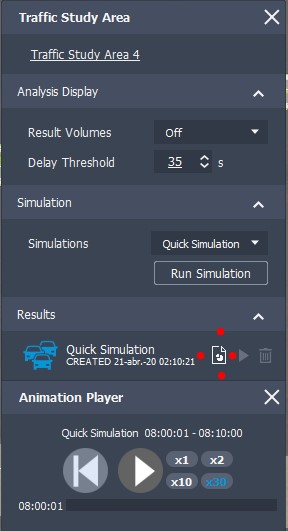
Under the results section click on the icon
05:31
to the left of the play simulation button.
05:33
It will download reports for cyclist, freight, people,
05:36
public transport, and private vehicles.
05:39
That is the one we are interested in.
05:41
Once in, we'll see multiple summaries
05:43
and under the result vehicle detector
05:45
a particularly interesting outcome,
05:47
the pollution generated.
05:53
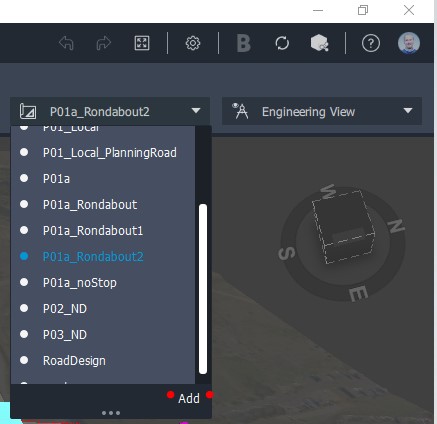
Reports for the three main proposals have been generated.
05:56
PO1 A, with have roundabouts, PO2 and PO3.
05:59
Although we feel that the PO3 will be the greenest proposal
06:02
as we observe, the best functional match
06:05
is the PO1 option with roundabout.
06:10
In order to have a big picture and a remarkable justification
06:14
to complete our data driven designs.
06:16
Let's include the pollution results
06:18
coming from the PO1 proposal with signalized intersections.
06:23
Check how the kilograms of CO2 difference.